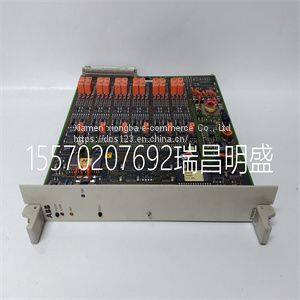
Module spare parts 216EA61b HESG324015R1 KHESG324258R3I HESG448230R1
Product Details
Product Details
Product Description
Product DescriptionFocus on DCS, PLC, robot control system and large servo system.
Main products: various modules / cards, controllers, touch screens, servo drivers.
Advantages: supply of imported original products, professional production parts,
Fast delivery, accurate delivery time,
The main brands include ABB Bailey, Ge / fuanc, Foxboro, Invensys Triconex, Bently, A-B Rockwell, Emerson, ovation, Motorola, xyvom, Honeywell, Rexroth, KUKA, Ni, Deif, Yokogawa, Woodward, Ryan, Schneider, Yaskawa, Moog, prosoft and other brands
| 216EA61b HESG324015R1 KHESG324258R3I HESG448230R1 |
>> 2024 Free Samples Aviation Blanket Airline Disposable Airline Blanket
>> HONEYWELL CC-PAIN01 C300 controller
>> Cbmmart Luxury Modern Lacquer MDF Self Assemble Storage Furniture Timber Kitchen Cabinet
>> Hot sale Used for chicken, duck, goose, quail, pigeon slaughtering automatic depilation machine
>> Wholesale Salon Technician Chair Mirror Station Stool for Sale
>> Flexible Plastics Standard Clear PVC Film Roll Strip Door Curtain Roll Outdoor Transparent PVC Curtain
>> Bored Piles Crosshole Sonic Logging CSL Analyzer 4 Probes Pile Integrity Tester
>> Sexy Bra Cup Removable Softbra Cup Women Swimsuit Bra Cups for Decoration
>> High quality Hunting knife Damascus steel with Horn handle
>> Computerized Embroidery Machine Portable Design Small Home Use Flat Cap Garments Embroidery
>> Shengyifa Modern Bathroom WPC PVC Interior Solid Wood Villa Door Skin
>> 6000kg/H Food Grade PET Bottle Recycling Machine
>> Bamboo LED Smart Alarm Clock Time Temperature Display Wireless Charger Clock
>> Rechargeable Electric Simulation Bird Remote Control Toy
>> Book Binding Sewing Machine, Electric Stapler Machine, Electric Stapler Machine
>> Super-Above Concrete Mixer Truck 6m3 8m3 10m3 Concrete Mixer Cement Truck for Sale
>> Factory direct sale plastic mixer gravimetric batch vertical blender
>> 8mm duct rodders cable puller 15mm push rod cable reel
>> Wholesale PVC Waterproof Bag, Phone Bag
>> Carbide Inserts Penta24n200-S Lathe Tools High Quality External Turning Tool CNC Cutting Tools Penta24n200-S Turning Insert
>> Full digital USB ultrasound Laptop PC system
>> 0.875 Inch Self-Degradable Ball Sealer- Mechanical Integrity up to 12000psi-02
>> Heavy Duty 1325 Atc CNC Router Machine for Wood & Acrylic Sheet Servo Motor Single Spindle Richauto Control System New Condition
>> High Water Absorbency PVA Pet Bath Towel
>> Poultry Chicken Cage Wire Mesh Production Machine
>> Used Second Hand Mitsubishi CO2 Laser Cutting Machine Ml3015hv2-40CF Upgrade to Fiber Laser Cutting Machine
>> Manual Grain Sheller Corn Sheller for Home and Market Use
>> Fashion top quality brand Skmei 1533 wholesale minimalist ladies quartz watch luxury diamond dial women wristwatch
>> Temp Fence Temporary Chain Link Fence Panel 6x12 Rent a fence China supplier factory barrier Stand clamp accessories
>> Modern Patio Garden Hotel Rattan Outdoor Furniture Swimming Pool Wicker Sofa Rattan Lounger Chair Aluminum Rattan Furniture